Graph information
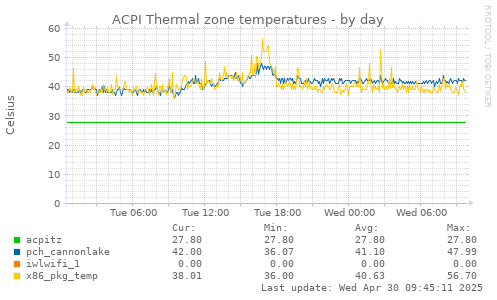
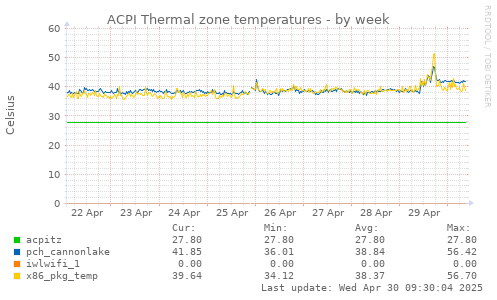
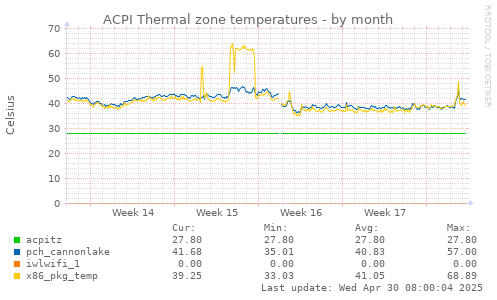
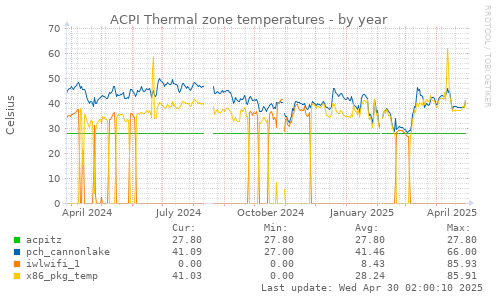
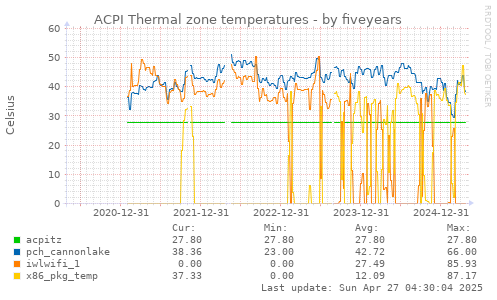
This graph shows the temperature in different ACPI Thermal zones. If there is only one it will usually be the case temperature.
| Field | Internal name | Type | Warning | Critical | Info |
|---|---|---|---|---|---|
| acpitz | thermal_zone0 | gauge | |||
| pch_cannonlake | thermal_zone1 | gauge | |||
| iwlwifi_1 | thermal_zone2 | gauge | |||
| x86_pkg_temp | thermal_zone3 | gauge |
Zooming is very easy, it's done in 3 clicks (regular clicks, no drag&drop):
- Click to define the start of zoom.
- Click to define the ending of zoom.
- Refresh.
You can use the interactive form too.