Graph information
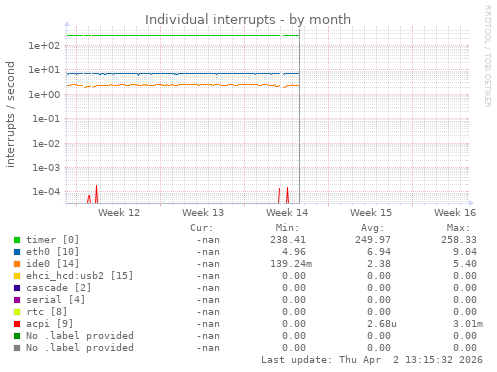
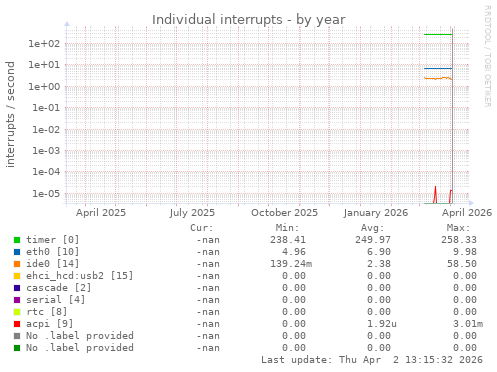
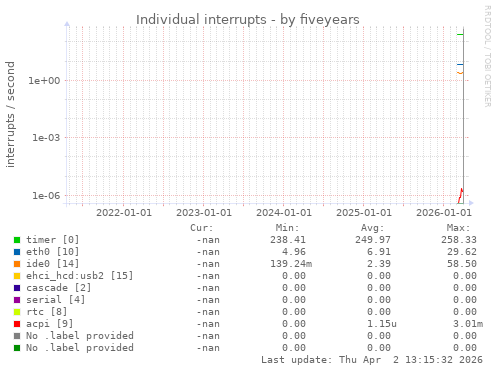
Shows the number of different IRQs received by the kernel. High disk or network traffic can cause a high number of interrupts (with good hardware and drivers this will be less so). Sudden high interrupt activity with no associated higher system activity is not normal.
| Field | Internal name | Type | Warning | Critical | Info |
|---|---|---|---|---|---|
| timer [0] | i0 | derive | Interrupt 0, for device(s): timer | ||
| eth0 [10] | i10 | derive | Interrupt 10, for device(s): eth0 | ||
| ide0 [14] | i14 | derive | Interrupt 14, for device(s): ide0 | ||
| ehci_hcd:usb2 [15] | i15 | derive | Interrupt 15, for device(s): ehci_hcd:usb2 | ||
| cascade [2] | i2 | derive | Interrupt 2, for device(s): cascade | ||
| serial [4] | i4 | derive | Interrupt 4, for device(s): serial | ||
| rtc [8] | i8 | derive | Interrupt 8, for device(s): rtc | ||
| acpi [9] | i9 | derive | Interrupt 9, for device(s): acpi | ||
| No .label provided | iLOC | derive | Local (pr. CPU core) APIC timer interrupt. Until 2.6.21 normaly 250 or 1000 pr second. On modern 'tickless' kernels it more or less reflects how busy the machine is. | ||
| This field has the following extra information: NOTE: The plugin did not provide any label for the data source iLOC. It is in need of fixing. | |||||
| No .label provided | iNMI | derive | Nonmaskable interrupt. Either 0 or quite high. If it's normaly 0 then just one NMI will often mark some hardware failure. | ||
| This field has the following extra information: NOTE: The plugin did not provide any label for the data source iNMI. It is in need of fixing. | |||||
Zooming is very easy, it's done in 3 clicks (regular clicks, no drag&drop):
- Click to define the start of zoom.
- Click to define the ending of zoom.
- Refresh.
You can use the interactive form too.