Claudio Satriano
Physicien Adjoint at the Institut de Physique du Globe de Paris

Research Activity
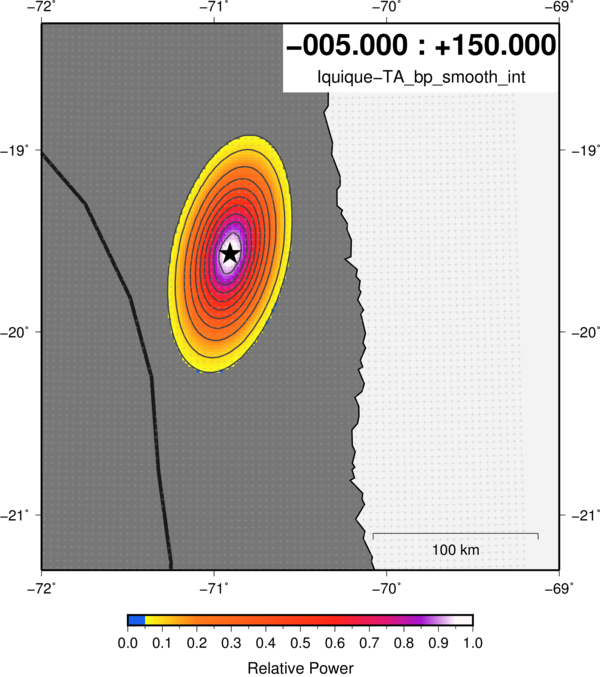
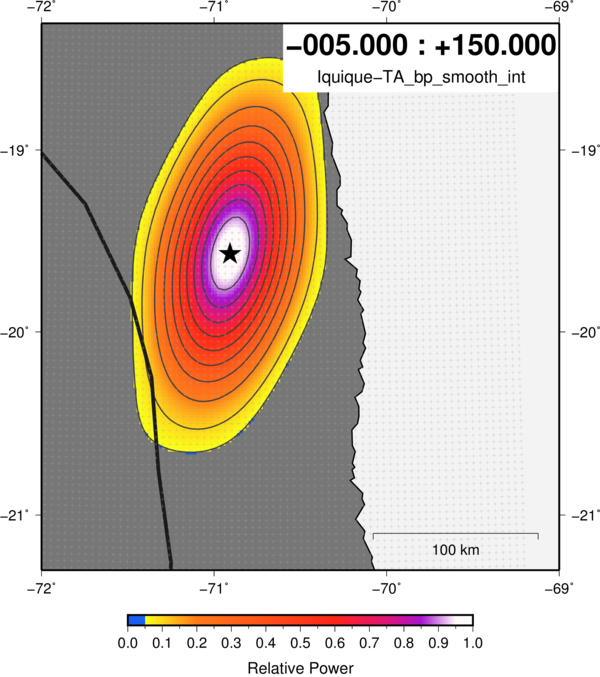
Array response function @1Hz
|
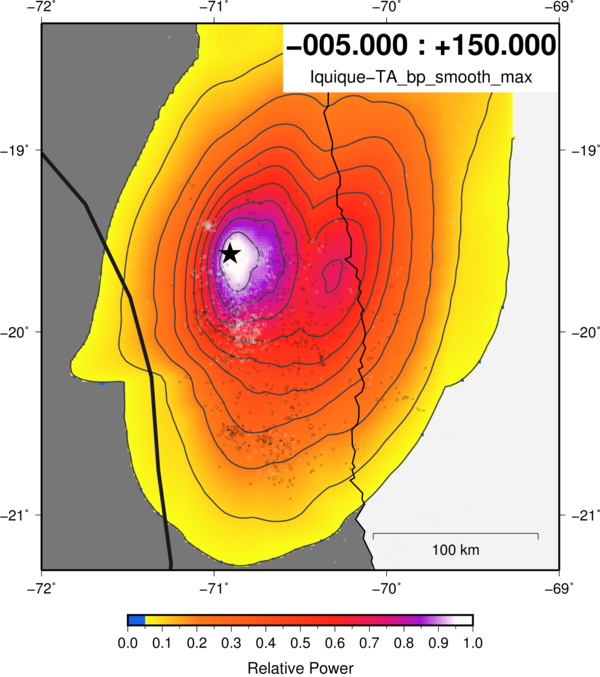
Maximum beam power over time
|
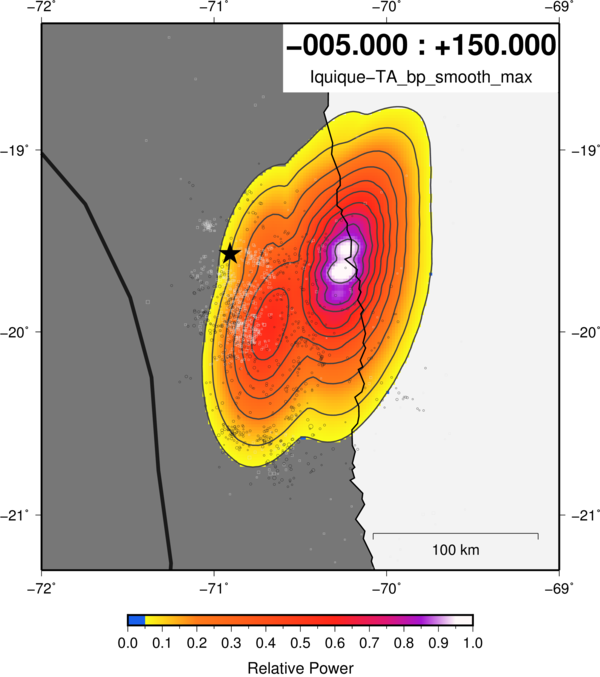
Array response function @1Hz
|
Maximum beam power over time
|
|
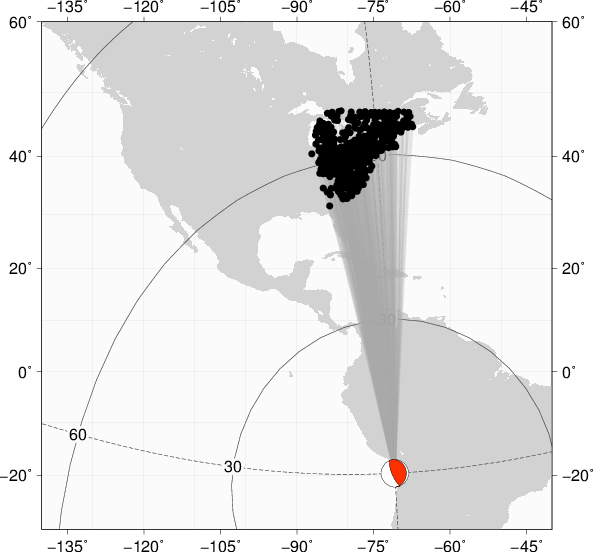
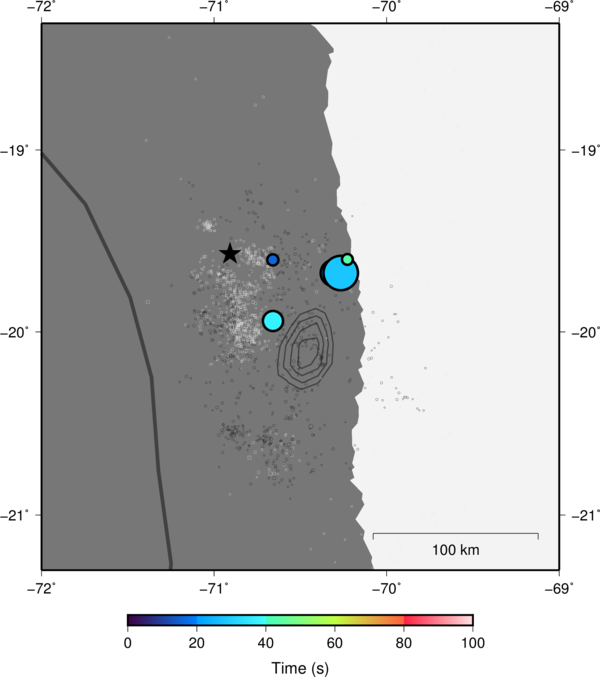
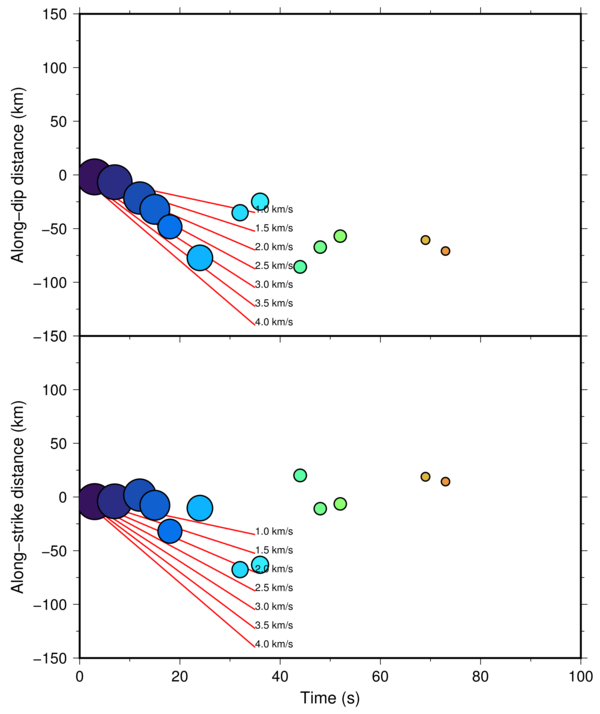
Back projection peaks - Linear stack, semblance weight |
Back projection peaks - Semblance |
|
|
|
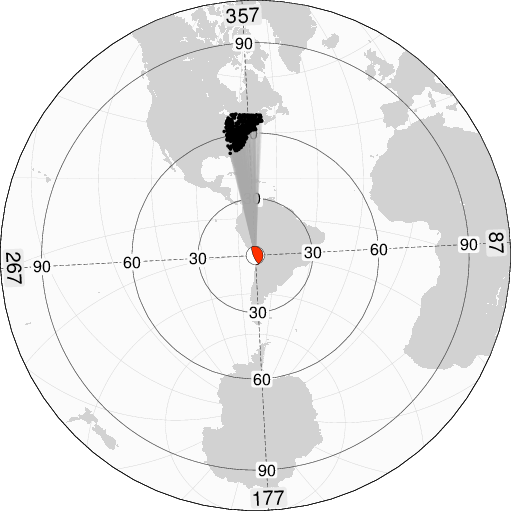
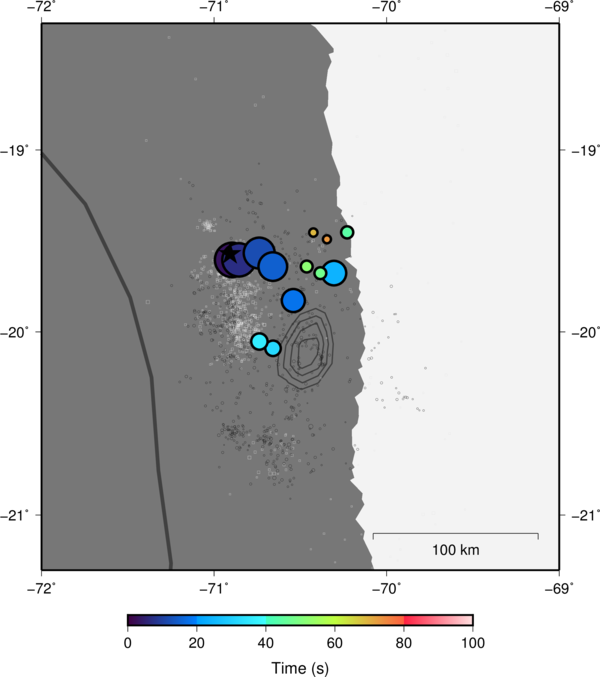
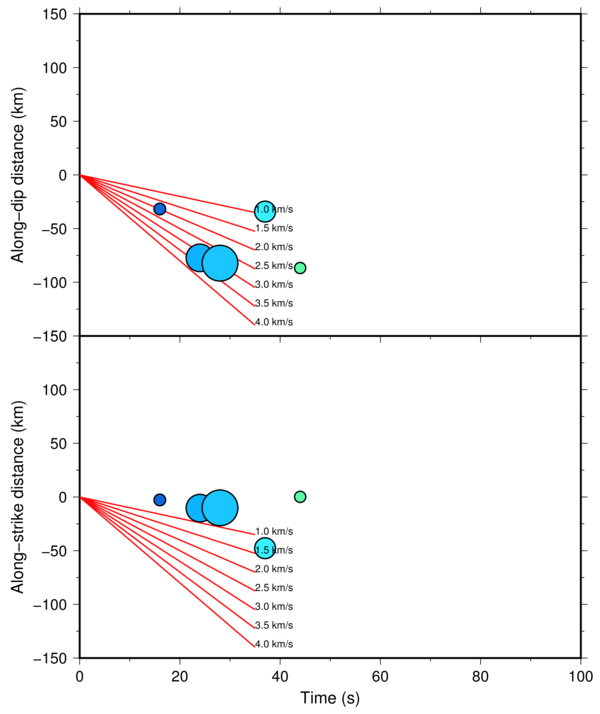
Back projection peaks, projected - Linear stack, semblance weight |
Back projection peaks, projected - Semblance |
|
|
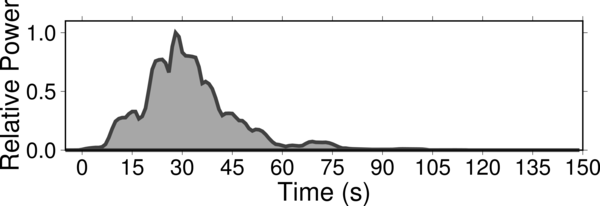
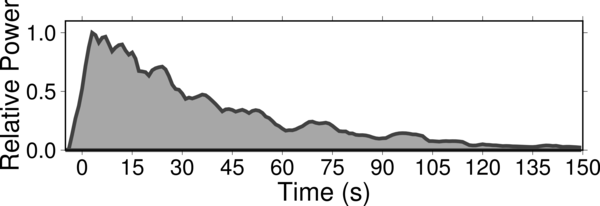
| Energy time function - Linear stack, semblance weight | Energy time function - Semblance |
|
|
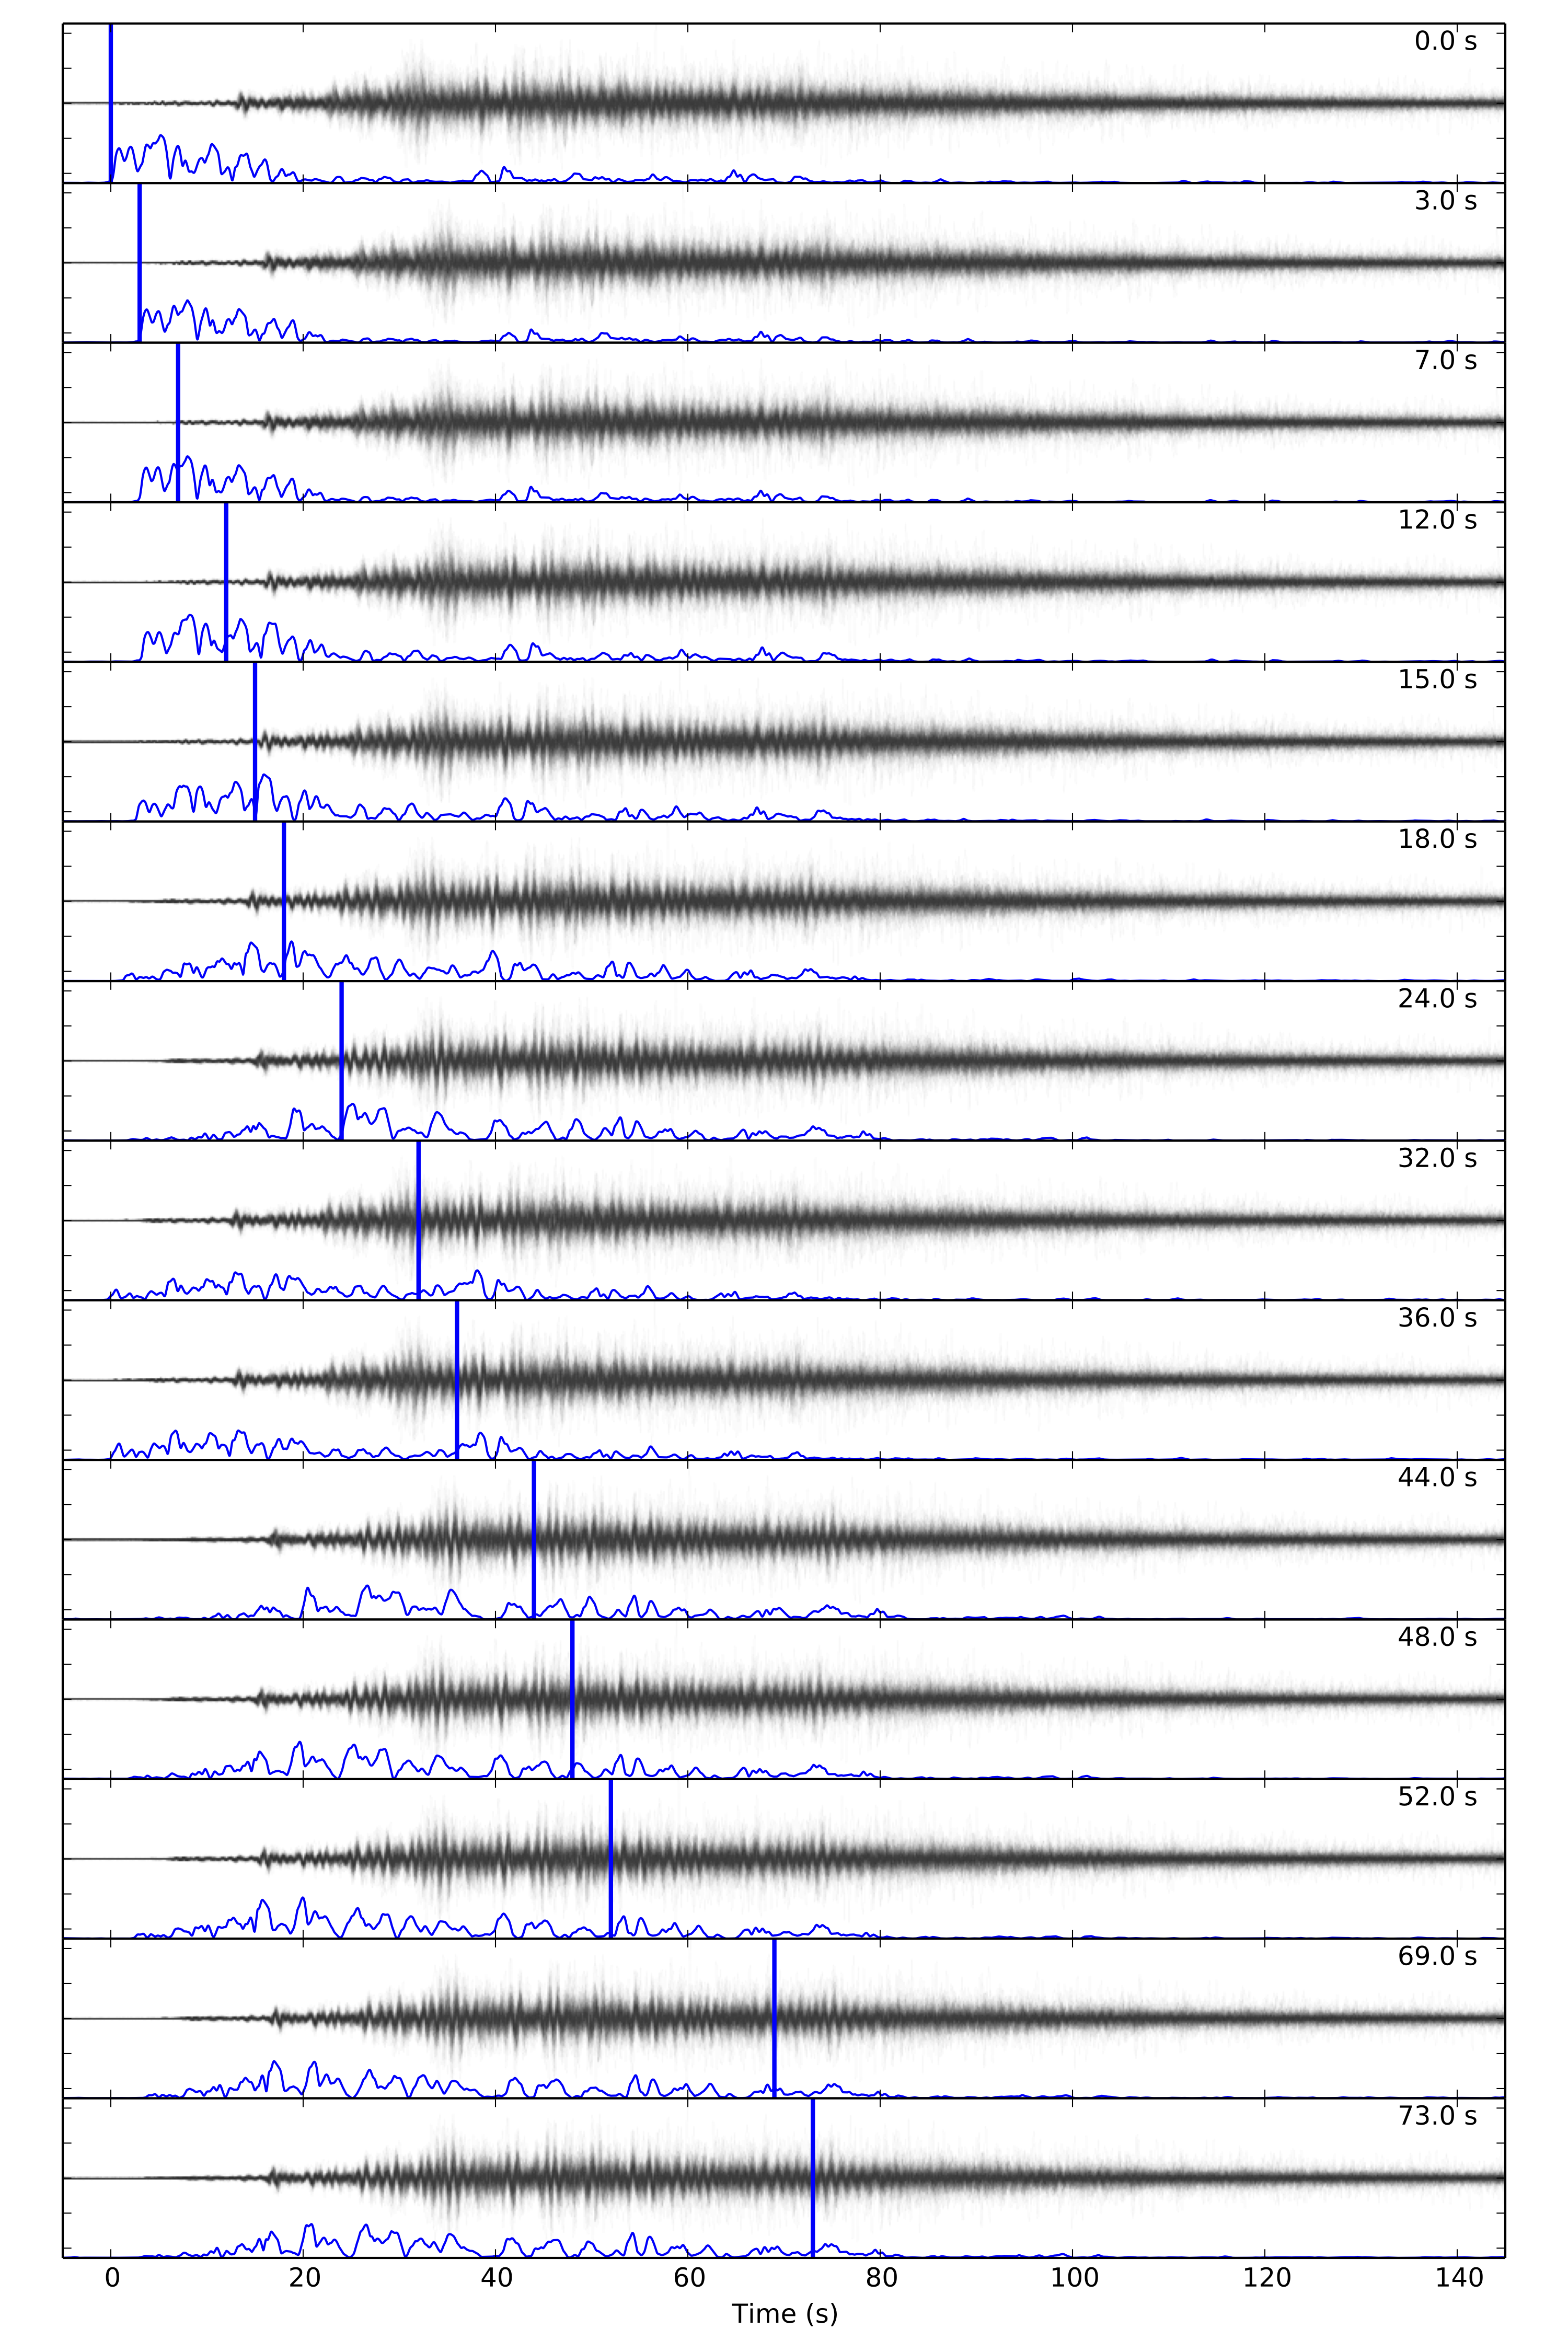
| Trace alignment - Linear stack, semblance weight | Trace alignment - Semblance |
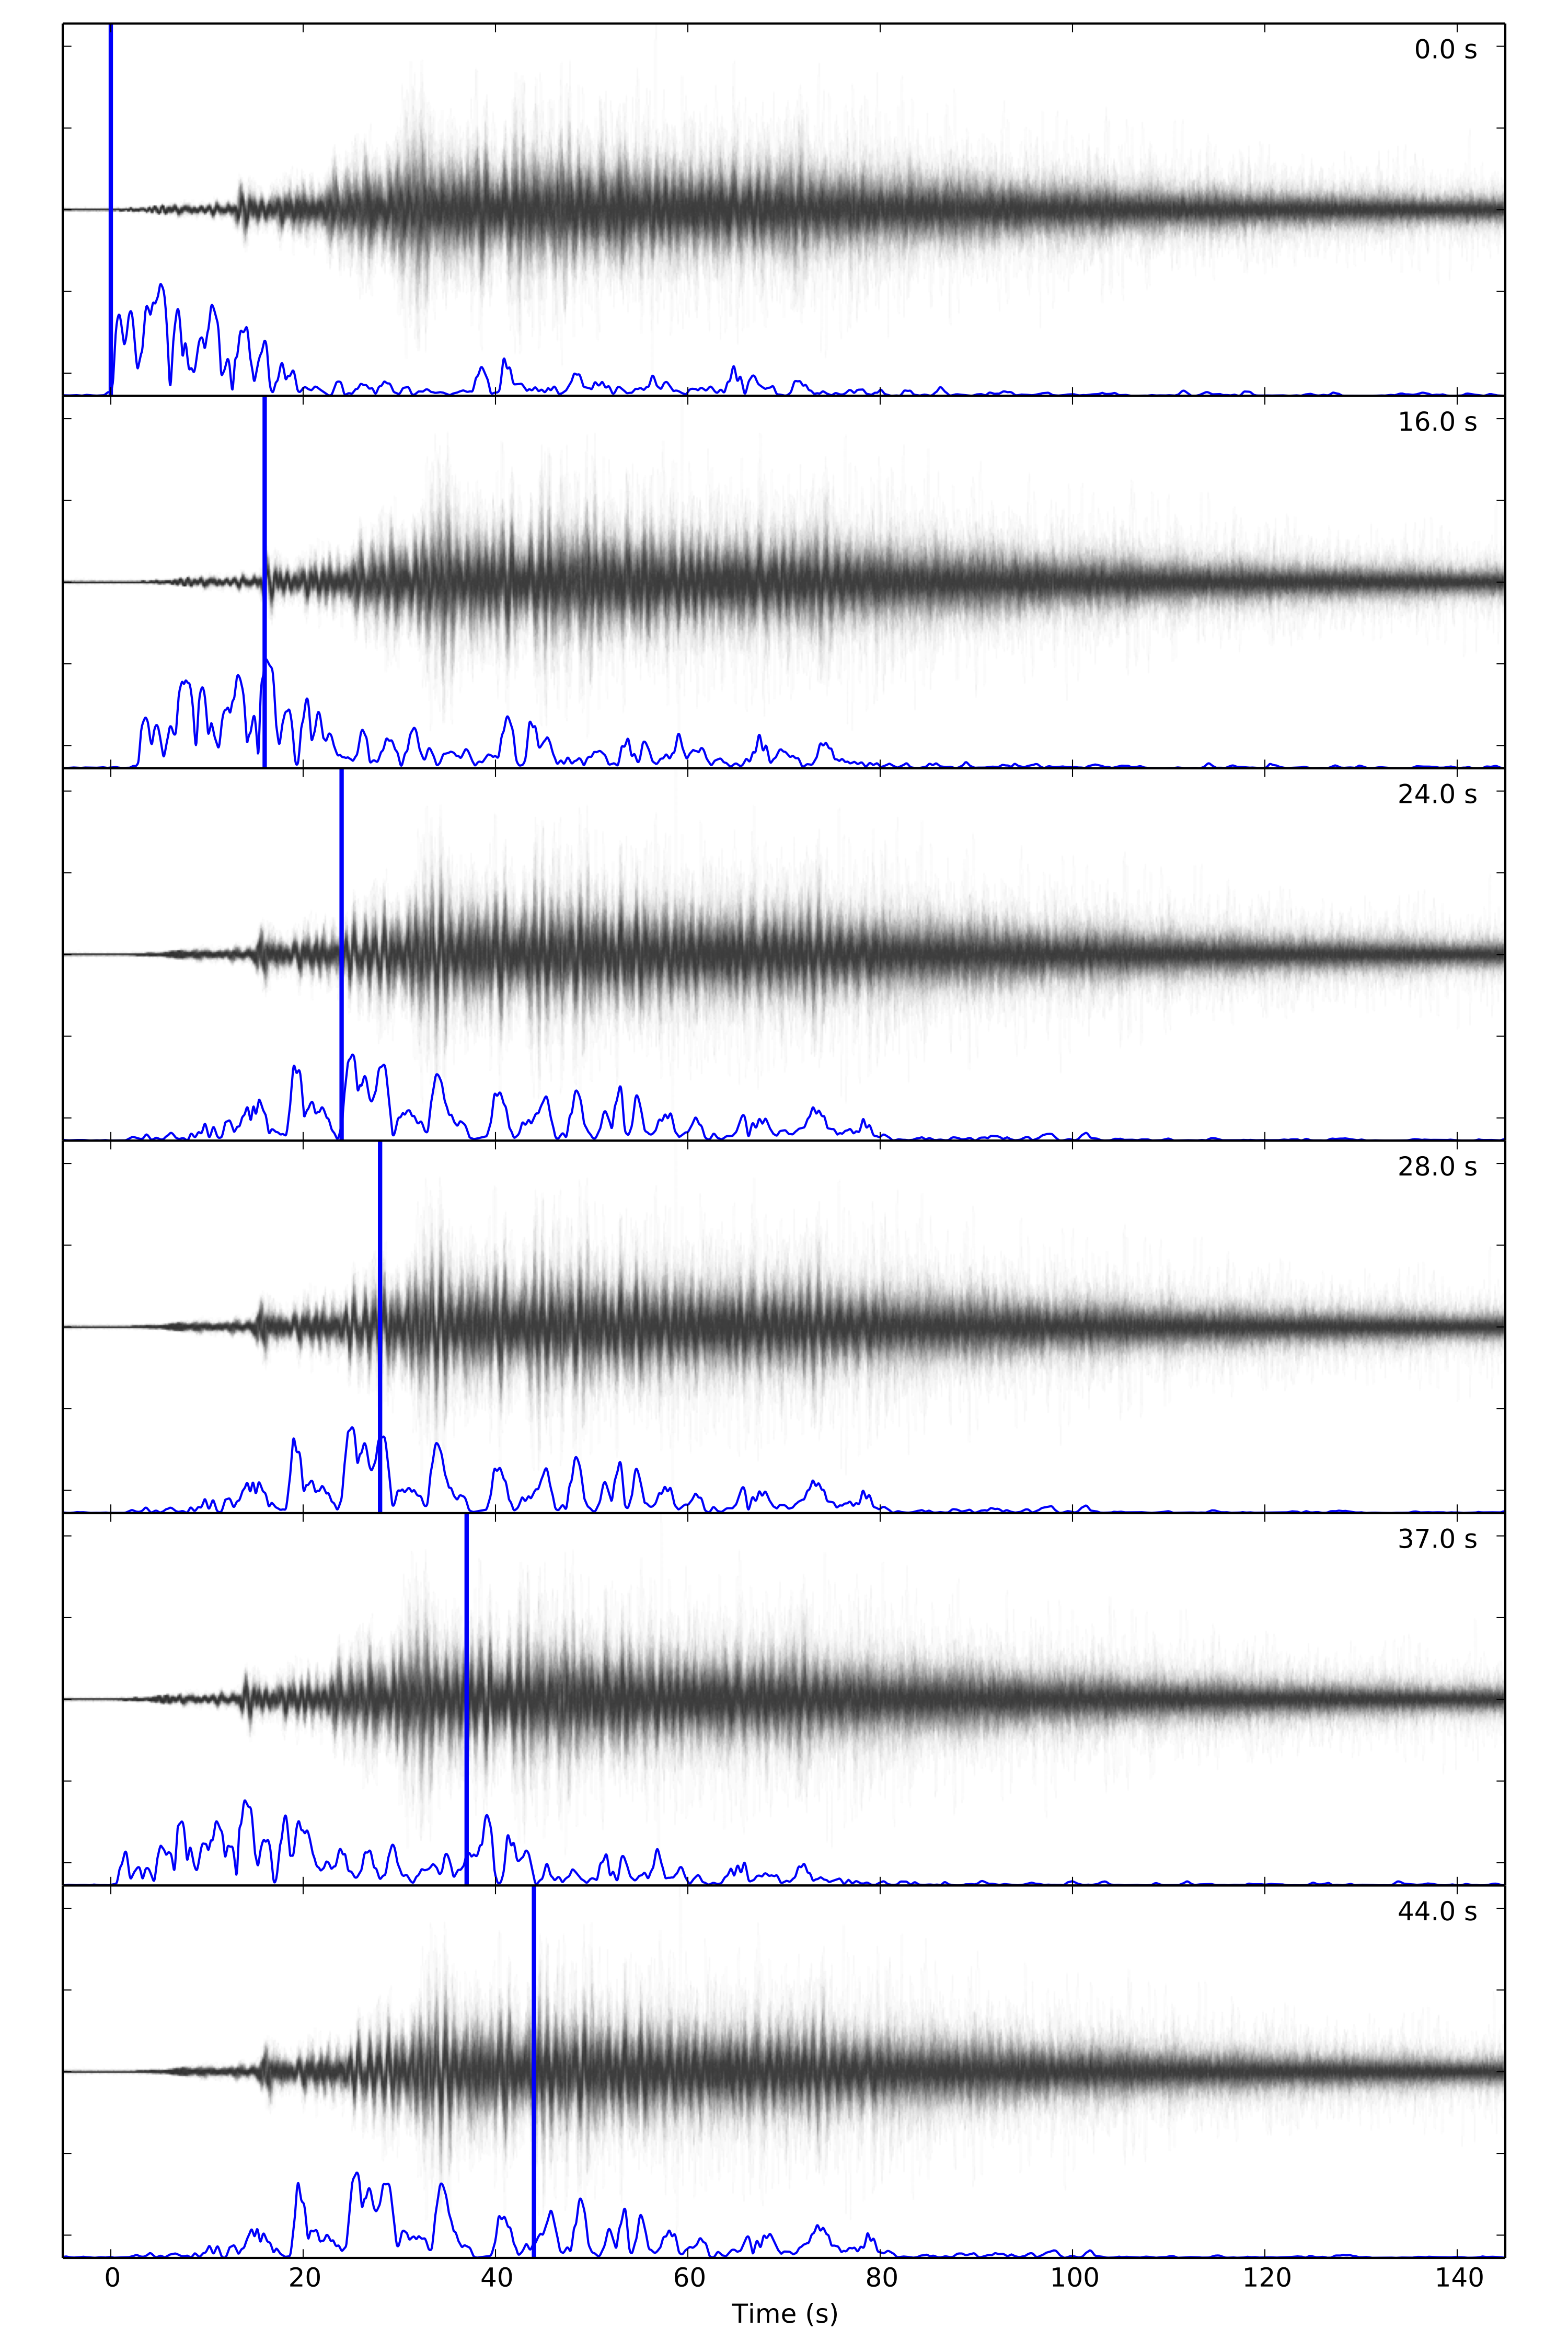
|
|